Why Escalation Matters in Project Finance
At its core, financial modelling boils down to two challenges: placing values correctly in time, and adjusting those values correctly for the passage of time. Get escalation wrong, and the entire model is compromised.
Inflation is the sustained increase in the general price level of goods and services in an economy over a period of time. When the price level rises, each unit of currency buys fewer goods and services — reflecting a reduction in purchasing power. In project finance, we deal with cash flows that span 20 to 30 years or more. Even at a modest 3% annual inflation rate, a cost of $100 today becomes $181 in 20 years. Ignore this, and your model fundamentally misstates the economics of the project.
However, monetary inflation is not the sole driver of price adjustments over time. A buyer and seller of gas may agree that the price increases by a contractually agreed amount, independent of developments in inflation. For this reason, practitioners use the more generic term escalation to describe the process of adjusting any modelling parameter's value over time — whether driven by inflation, contractual step-ups, market forces, or regulatory mechanisms.
While values generally increase over time, they can also decrease — a devaluing currency exchange rate being one example. So somewhat confusingly, "escalation" modelling also covers "de-escalation" scenarios. Context is everything.
Escalation deserves extra care for two reasons. First, it is inevitably applied to calculations throughout a financial model, many of them of substantial materiality. Incorrectly lagging or leading the calculations by even a single model period, even with a low escalation rate, can affect the results more than is acceptable. Second, escalation involves translating the continuous reality of time into the discrete "points in time" approximation required in the column-by-column structure of spreadsheets. Being aware of these issues — and making appropriate, explicit approximations — is vital to good modelling.
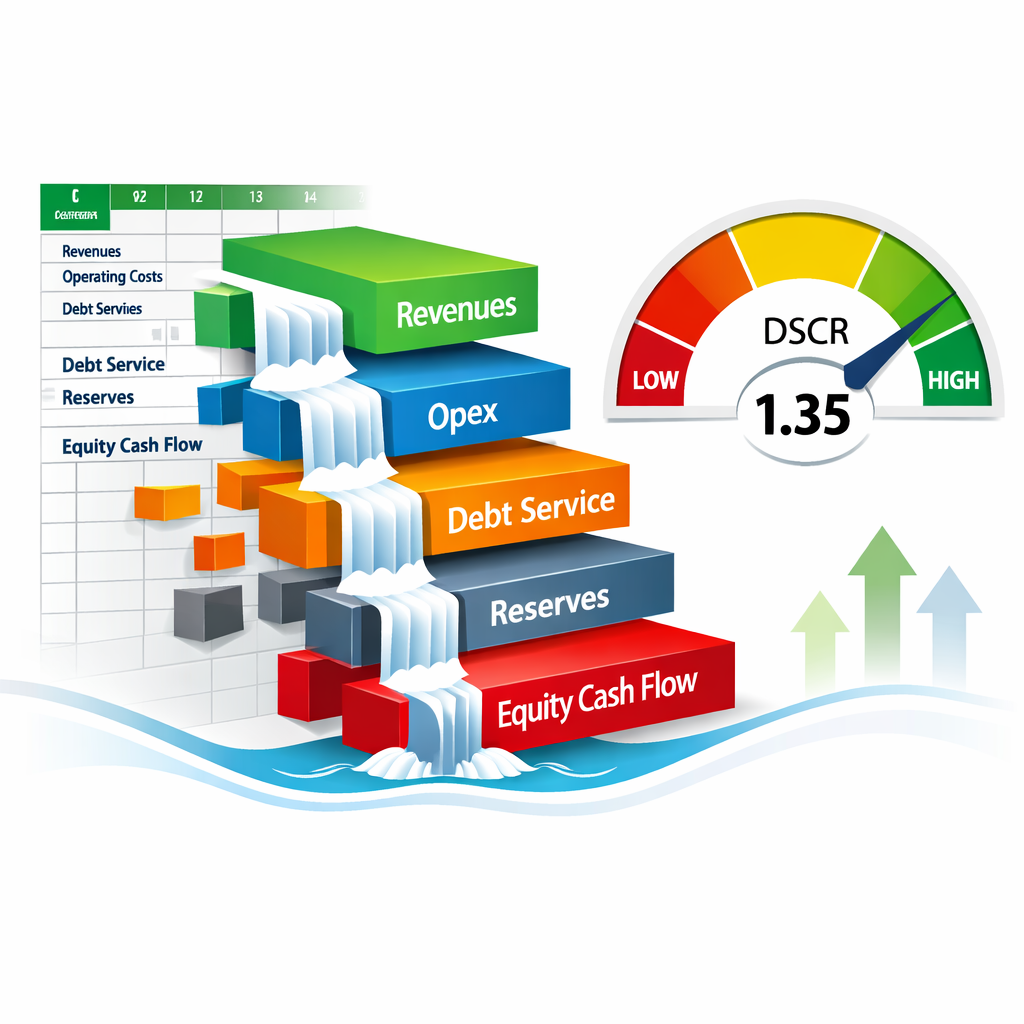
In project finance specifically, inflation creates an asymmetric effect. During construction, high inflation increases investment costs and is detrimental to returns and cover factors. During the operating period, high inflation increases revenues relative to nominally fixed debt service, which is beneficial. This asymmetry is why well-built models include the option for at least two inflation rate scenarios over the project life, allowing these differing effects to be tested separately.
Two Forms of Escalation
Before building any formulas, you must identify which form of escalation applies. The modelling approach differs fundamentally between the two.
Known Dates, Known Jumps
Applies to a value that has a known date (or dates) upon which it will escalate. Typical in contracted prices, regulated tariffs, and defined adjustment mechanisms.
Example: A gas price of 18.00 p/therm agreed contractually to step up by 1% on 1 Aug 2000 and by 3% on 1 Feb 2001.
Market-Driven, Smooth
Applies to values presumed to generally escalate from one modelling period to another, where exact dates of price changes are too frequent or uncertain to model individually.
Example: A spot gas price driven purely by market forces, where projecting exact dates of price changes would be meaningless.
The distinction matters because each form requires a different modelling approximation. A contracted gas price with defined step-up dates should be modelled as stepped escalation. That same commodity priced at spot, with price movements determined by market forces, should be modelled as continuous escalation. Applying the wrong form creates systematic bias in your cash flow projections.
While presented in an inflation context, these modelling principles apply generally to any change in a value over time — including production volumes, traffic forecasts, demand curves, and more.
Escalation Rates & Decompounding
Once you know the escalation form, determine the rate. Two issues arise: does the rate change over time, and does the rate's time period match the model's time period?
The Compounding Problem
Inflation is universally quoted as a percentage per annum. A quoted annual inflation of 4.00% means that a loaf of bread costing £1.00 today will cost exactly £1.04 in a year's time. But what if your model uses semi-annual periods?
The naive approach is to divide the annual rate by 2, applying 2.00% per period. This yields a price of £1.02 after six months and £1.02 × (1 + 2%) = £1.0404 after a year — not £1.04. While the variation may seem trivial for short periods at low inflation, the error compounds over time and becomes particularly significant in higher inflation environments or long-horizon models typical of project finance.
rannual = (1 + rsemi)2 − 1
rsemi = (1 + rannual)(1/2) − 1
/* General form for any sub-period */
rperiod = (1 + rannual)(period / 12) − 1
Decompounding 4% Annual to Semi-Annual
rsemi = (1 + 0.04)0.5 − 1 = 1.0198 − 1 = 1.98% per period
Verification: (1 + 0.0198)2 = 1.0400 ✓ — This properly produces 4.00% over a full year, unlike the naive 2.00% which overshoots to 4.04%.
The generalised principle extends to any sub-period. For three months of inflation at 15% per annum, the factor is (1.15)0.25 = 1.0356, meaning 3.56% for the quarter — not 3.75% from simple division.
In a 25-year project finance model with semi-annual periods, the naive approach (dividing the annual rate by 2) applied at 5% inflation produces a cumulative error of over 3% by year 25. For a $500M project, that is $15M+ of misstatement — material by any standard.
The Escalation Base Date
For any given value, you must ascertain the date at which the value applies. This is often referred to as the "cost estimate date" for construction costs.
For stepped escalation, the base date is usually straightforward — any value remains constant over a known stretch of time. What matters most is ensuring the first forecast date of a step-up is properly understood. For example: 18.00 p/therm from 1 Feb 2000, first stepping up on 1 Aug 2000.
For continuous escalation, the base date requires more thought. A given price may effectively be an average value over a period — say, a spot gas price of 19.45 p/therm for the six months from 1 Jan 2000 to 30 Jun 2000. In reality, this price is not as at a specific date, but over a given period. Specifying a particular date for modelling purposes requires careful consideration.
When the value date differs from the model timeline start date, an adjustment factor must be applied:
/* If value_date < start_date → factor > 1.00 (inflates forward) */
/* If value_date > start_date → factor < 1.00 (deflates back) */
This approach works well when the initial inflation rate can reasonably be assumed to apply between the value date and the timeline start, and when the adjustment period is short enough that a 365-day year assumption does not cause material disparities. For value dates substantially before or after the timeline start, more sophisticated approaches are needed — including pre-timeline inflation rate assumptions or period-by-period lookups.
Pre-Model Deflation: When the Model Starts Before the Reference Date
In bid-stage models, the model timeline often starts before Financial Close or the contract reference date. In this case, the value date adjustment produces a negative exponent, effectively deflating the index backward in time. For example, if the model starts on 1 Jan 2025 but the Financial Close is expected on 1 Jul 2025, the start index becomes (1 + r)(-0.5) — a value less than 1.0 that "unwinds" six months of inflation. This is perfectly correct mathematically, but can be counter-intuitive to reviewers who expect all inflation factors to be ≥ 1.0. Always annotate this in your model.
When the model start date precedes the FC date, a start index adjustment of (1 + r)(FC_date − model_start) / 365 anchors the inflation index to the correct reference point. If the exponent is positive, it inflates forward; if negative, it deflates back. The same formula handles both directions — no special cases needed.
Modelling Approaches in Practice
The core challenge: translating continuous reality into the discrete columns of a spreadsheet. Each escalation form has its own best-practice approach.
Modelling Stepped Escalation
Consider a semi-annual model with Period A (1 Jul – 31 Dec 2000) and Period B (1 Jan – 30 Jun 2001). We have one model price per column. A gas price of 18.00 p/therm steps up by 1% on 1 Aug 2000 (to 18.18 p/therm) and by 3% on 1 Feb 2001 (to 18.73 p/therm).
For stepped escalation, the approach is to calculate the time-weighted average for each period:
| Period | Calculation | Result |
|---|---|---|
| Period A Jul–Dec 2000 |
(1 × 18.00 + 5 × 18.18) / 6 | 18.15 p/therm |
| Period B Jan–Jun 2001 |
(1 × 18.18 + 5 × 18.73) / 6 | 18.64 p/therm |
The time-weighted average is only accurate if the value being multiplied (e.g., gas volume) is constant throughout the period. If consumption is unevenly distributed — such as retail toy sales where 50% may occur in December — the weighted average approach will materially over- or understate the true cost. Always consider the distribution of the multiplier within the period.
Modelling Continuous Escalation
For continuous escalation, we must estimate the time-weighted average of an artificially imposed "escalation curve" — not of actual observed prices. Given a spot gas price average of 19.45 p/therm for the six months ending 30 Jun 2000 and a forecast of 4% annual escalation, we project forward:
| Period | Semi-Annual Rate | Projected Average |
|---|---|---|
| Base Period (Jan–Jun 2000) | — | 19.45 p/therm |
| Period A (Jul–Dec 2000) | 1.98% | 19.83 p/therm |
| Period B (Jan–Jun 2001) | 1.98% | 20.23 p/therm |
The Mid-Period Approximation
For low escalation rates, a continuous escalation curve can be closely approximated by straight line segments drawn through the value at the middle of each period. This leads to an elegant simplification: for the continuous escalation form, the time-weighted average price for a period is effectively equal to the price calculated at the mid-period point.
Pricemid-A = Base_Price × (1 + rannual) ^ (months_to_midpoint / 12)
/* If base price of 19.45 is an average for Jan–Jun 2000 (midpoint = 1 Apr): */
/* Months from 1 Apr to 30 Sep = 6 months */
Pricemid-A = 19.45 × (1 + 0.04) ^ (6/12) = 19.83
The base date matters critically. If instead of being given an average price for the base period, you were given a price as at a specific earlier date (say 31 Jan 2000), the calculation shifts. You would need to escalate from that earlier date to the mid-point of Period A — a longer stretch of time — yielding a higher modelled price. In that scenario: 19.45 × (1.04)(8/12) = 19.97 p/therm.
As Penelope Lynch notes in Financial Modelling for Project Finance: unless specific information is available about when prices adjust, it is reasonable to assume inflation is consistent at the given rate during each model period. The mid-period value gives an acceptable approximation to the average value produced by this process, with a fairly simple and transparent calculation.
Two Ways to Calculate Mid-Period Values
In practice, you will encounter two approaches to computing the mid-period value. The article's formula table uses the geometric method: Mid-Point Factor = End_Factorprev × (1 + r)0.5. However, many production models — including real-world project finance models — use the arithmetic method: Mid-Point = AVERAGE(BoP, EoP), which is simply the average of the beginning-of-period and end-of-period index values.
Prior EoP × (1 + r)0.5
Mathematically precise for an exponential growth curve. Gives the value at exactly the temporal mid-point of continuous compounding.
Use when: Theoretical precision matters and the audience is comfortable with the formula.
AVERAGE(BoP, EoP)
The simple average of the start and end index values for the period. More intuitive and easier to audit in a spreadsheet.
Use when: Auditability and simplicity are priorities. The standard in most production PF models.
For inflation rates below roughly 10% per annum, the two methods converge very closely — the difference is typically less than 0.01% per period. At higher rates (common in emerging markets), the gap widens and the geometric method becomes more accurate. Either approach is defensible; what matters is that the choice is documented and applied consistently.
The BoP / EoP Index Chain
Production project finance models don't just compute factors — they maintain an explicit index chain that you can trace, audit, and verify period by period.
Rather than calculating mid-point factors directly from a formula, the production approach builds an index that chains through time: the End of Period (EoP) value of one period becomes the Beginning of Period (BoP) value of the next. The Mid-Period value is then derived from BoP and EoP. This BoP → EoP → next BoP chain mirrors how published price indices (CPI, RPI) actually work, making the model's output directly comparable to real-world data.
(Period 1 starts at 1.0000)
Decompounded via days/365
The value used for flow items
BoP1 = 1.0000
EoP1 = BoP1 × (1 + rannual)days₁/365
Mid1 = AVERAGE(BoP1, EoP1)
/* Period 2 onward — the chain */
BoPn = EoPn-1
EoPn = BoPn × (1 + rannual)daysₙ/365
Midn = AVERAGE(BoPn, EoPn)
Notice that this approach uses days_in_period / 365 rather than a fixed 0.5 exponent. This is a refinement over the simpler semi-annual formula — it accounts for the fact that not all half-years have exactly 182.5 days. In production models with monthly or quarterly periods, this precision matters more.
With an explicit index chain, any reviewer can pick any period in the model and independently verify the BoP (should equal prior EoP), the growth calculation, and the mid-period average. This is far more transparent than a single-line factor formula that compounds invisibly from Period 1. Audit trail = trust.
Contract Year Index (for Stepped O&M)
A useful extension of the index chain is the Contract Year Index, which only resets at contract year boundaries. While the mid-period index moves smoothly every period, the contract year index "freezes" the BoP value at each contract year start and holds it until the next boundary. This is used when O&M contracts are indexed annually on a specific date rather than continuously.
/* Resets to the BoP only when a new contract year begins */
/* Otherwise carries forward the previous value unchanged */
Phase-Aware Rate Selection
Real projects have different inflation environments during pre-construction, construction, and operations. The elegant way to handle this avoids nested IF statements entirely.
In a typical project finance model, the timeline is divided into mutually exclusive phases — pre-construction, construction, and operations. Each phase may have a different inflation assumption. A common but fragile approach is to nest IF statements: =IF(phase="construction", rate_constr, IF(phase="operations", rate_ops, rate_pre)). This becomes unreadable and error-prone as phases multiply.
The production technique, used in models like the Kabd Municipal Solid Waste project, is far cleaner:
| Row | H1 2025 | H2 2025 | H1 2026 | H2 2026 | H1 2027 |
|---|---|---|---|---|---|
| Pre-Constr Rate × Flag | 3.0% | 0.0% | 0.0% | 0.0% | 0.0% |
| Construction Rate × Flag | 0.0% | 5.0% | 5.0% | 5.0% | 0.0% |
| Operations Rate × Flag | 0.0% | 0.0% | 0.0% | 0.0% | 3.0% |
| Combined = MAX(above) | 3.0% | 5.0% | 5.0% | 5.0% | 3.0% |
Each rate is multiplied by its phase flag (1 when active, 0 otherwise). Since the flags are mutually exclusive, only one row is non-zero in any given period. MAX() then simply picks the active rate. This pattern is auditable (you can see exactly which rate is contributing), extensible (add a new phase by adding one row), and avoids the fragility of nested logic.
Since exactly one flag is 1 and the rest are 0, SUM() would give the same result. However, MAX() is the convention because it is more defensive: if a flag error ever causes two phases to overlap, MAX() takes the higher rate (a conservative outcome), whereas SUM() would double-count, producing a silently wrong result.
The Stepped / Continuous Toggle
In many concession-based projects, the same CPI index drives both smooth operating escalation and stepped contractual adjustments. A single switch controls which method applies.
The article has so far presented stepped and continuous escalation as separate tracks. In practice, however, both methods often coexist in the same model — even for the same cost line. An O&M contract might be indexed to CPI either continuously (adjusting smoothly each period) or on a stepped basis (resetting once per contract year). The choice depends on the contract terms, and the model should let the user toggle between them.
O&M_Index = IF(Switch = 1,
Mid_Period_Index, ← smooth, updates every period
Contract_Year_Index ← stepped, resets at CY boundaries
)
This is implemented as a single model switch on the Inputs sheet. When set to 1 (Continuous), the O&M escalation factor uses the mid-period CPI index — the smooth value that updates every period. When set to 0 (Stepped), it uses the contract year CPI index — the value that only resets when a new contract year begins. The rest of the model (base costs, value date adjustments, output calculations) remains unchanged. The user can flip the switch and instantly see the impact on cash flows and cover ratios.
Whichever method is selected for the base case, the model should document why — typically by reference to the relevant contract clause. The toggle exists so that sensitivity analysis can test the alternative, not so the choice can be left ambiguous.
Escalation Factors
Good modelling practice separates the escalation calculation from the amounts being escalated. Escalation factors are the bridge between the two.
An escalation factor is a dimensionless multiplier that, when applied to a "base" value, produces the escalated value for a given period. At the simplest level, you replace the starting price with 1.000 and apply the same averaging techniques discussed above. Presuming base values are relevant for the start of the forecast period, the construction is simple and transparent.
| Row | H1 2024 | H2 2024 | H1 2025 | H2 2025 |
|---|---|---|---|---|
| Annual Inflation Rate | 3.00% | 3.00% | 2.50% | 2.50% |
| Semi-Annual Rate (decompounded) | 1.489% | 1.489% | 1.242% | 1.242% |
| End-Point Factor | 1.0149 | 1.0300 | 1.0428 | 1.0558 |
| Mid-Point Factor | 1.0074 | 1.0224 | 1.0363 | 1.0492 |
The mid-point factor is used for continuously escalating operating costs and revenues. The end-point factor provides start-of-next-period values and is used for converting to real terms.
To maintain flexibility, the factor calculations should allow for inflation rates that vary over time. A common approach is to have a dedicated row containing the rate for each period. The factors then reference this row, and any change in how rates are input (e.g., switching from a single assumption to period-specific rates) only requires changing formulas in one row.
Contractual Escalation Factors
Some costs and revenues are subject to defined inflation adjustments applied at specified intervals — not general inflation. When these adjustments correspond to model periods, the factor in each period simply takes the prior period's factor and increases it by the applicable annual percentage in adjustment periods only, using an annual mask (1 in the relevant period, 0 otherwise).
Working with Indices
In practice, the most direct link to the real world is through published indices — CPI, RPI, or constructed blends of commodity and labour cost indices.
The use of indices becomes essential when the escalation base date is some time prior to the start of the model forecast. In this common situation, two indices are required because two dates matter:
The Forecast Starting Point
The most recently published index value, closest to the start of the forecast horizon. You project forward from this figure using your escalation techniques.
The Contract Reference Point
The index value at the date when your base cost or price was established — e.g., when a £4.2M maintenance contract was negotiated at a labour cost index of 210.6.
Indext = Indexlast actual × (1 + r)periods
/* Derive the escalation factor for each period */
Escalation_Factort = Indext / Indexbasis date
/* Apply to the base contract price */
Costt = Base_Price × Escalation_Factort
Costt = £4.2M × (Indext / 210.6)
In practice, contract escalation is often further complicated by the need to lag the indices used for a given period by some months, as data is only available some months after the period in question. This indexation lag must be carefully modelled — it is another area where precision matters. That said, many production models omit index lag for simplicity, particularly in feasibility-stage work. If you choose to omit it, document this as an explicit modelling approximation — don't leave it unaddressed.
Real vs. Nominal Values
Project finance models typically compute in nominal (money-of-the-day) terms, but investors and sponsors often want to see returns expressed in real terms to understand true purchasing power.
Nominal values are expressed in the currency of the period in which they occur — they include the effect of inflation. When you see "$150M revenue in 2035," that is a nominal figure. Real values strip out inflation, expressing everything in the purchasing power of a chosen base year. This allows meaningful comparison of cash flows across time.
Converting from nominal to real requires dividing by the appropriate inflation factor. The end-point escalation factor is typically used for point-in-time values (like dividends declared on a specific date), while mid-point factors are used for flow values that accrue over a period.
/* Example: $150M nominal revenue in Year 10, cumulative inflation factor = 1.344 */
Real_Value = $150M / 1.344 = $111.6M (in base-year dollars)
This conversion is critical for calculating real equity IRR — the return that sponsors actually experience in terms of purchasing power. A nominal IRR of 14% with 3% inflation translates to a real IRR of roughly 10.7%, which may tell a very different story about the project's attractiveness.
When Rates Change Within a Period
What happens when the economic forecast predicts an accelerating or decelerating rate within a single model period? Consider 16% p.a. for the first three months and 8% p.a. for the last three months of a semi-annual period.
A natural instinct is to time-weight the rates: three months at 16% and three months at 8% gives an average annual rate of 12%, or approximately 6% for the half-year. This yields a mid-period price of about £1.03 on a £1.00 base. But the true average price level works out closer to £1.035 — a 0.5% discrepancy. Three approaches exist:
First, you can derive the mathematically correct blended rate that produces the true time-weighted average at mid-period (about 14% annual equivalent in this example). Second, you can simply apply one of the two rates to the entire period — recognising that escalation forecasts themselves are rough estimates. Third, you can calculate a time-weighted rate that at least adjusts for the duration each rate applies.
The point is not to find "the answer" but to reinforce good analytical methodology: first understand what is actually happening in reality (at least on the basis that assumptions prove correct), then think carefully about whether some approximation is warranted in the interests of modelling simplicity — and in the context of other inaccuracies already embedded in the methodology. Your decision depends on the circumstances of the business being modelled.
Common Pitfalls & Best Practices
The errors that most frequently appear in escalation modelling — and how to avoid them.
Pitfall 1: Simple Division Instead of Decompounding
Dividing the annual rate by the number of sub-periods (e.g., 4% ÷ 2 = 2% per half-year) instead of properly decompounding (1.040.5 − 1 = 1.98%). The error compounds over the project life and is magnified in high-inflation environments.
Pitfall 2: Off-by-One Period Errors
Applying escalation one period too early or too late. In a 25-year model at 3% inflation, a single-period lag on a $50M annual revenue stream creates a cumulative NPV error in the millions. Always verify your first escalated period against a manual calculation.
Pitfall 3: Ignoring the Base Date
Assuming all input values are at the model start date. In reality, different cost categories come from different studies at different dates. Each needs its own value date adjustment to be inflated or deflated to a common starting point.
Pitfall 4: Applying Continuous Techniques to Stepped Values
Using mid-period approximation for a contractually stepped price. This smooths out what should be discrete jumps, misallocating revenue or cost between periods — particularly problematic for debt service cover ratio calculations.
Pitfall 5: Neglecting the Volume Distribution
The time-weighted average price is only correct if the volume (or quantity multiplier) is evenly distributed across the period. If 80% of throughput occurs in the first two months, the effective price is much closer to the pre-escalation level — and the weighted average overstates the true cost.
Practical example: A municipal solid waste (MSW) project in a region with seasonal waste volume variation. If summer months generate 40% more waste than winter months, applying a uniform mid-period inflation factor to an annual volume figure will misstate the true cost. In such cases, consider monthly sub-calculations for the affected periods, or at minimum, document the approximation and its estimated magnitude.
Pitfall 6: Undocumented Approximations
Every model makes approximations — AVERAGE(BoP, EoP) instead of geometric mid-point, omitting index lag, assuming even volume distribution, using 365 days per year. None of these are "errors" if they are intentional. They become errors when they are undocumented. Always maintain a list of modelling approximations, ideally on a dedicated assumptions or methodology sheet, so that reviewers and auditors can assess their materiality.
The Escalation Modelling Checklist
Formula Summary
| Concept | Formula |
|---|---|
| Future Value | FV = PV × (1 + r)n |
| Decompound Annual → Sub-Period | rsub = (1 + rannual)(sub_period / 12) − 1 |
| Decompound (days-based) | EoP = BoP × (1 + rannual)(days / 365) |
| Value Date Adjustment | (1 + r)((start_date − value_date) / 365) |
| Mid-Point (geometric) | End_Factorprev × (1 + rperiod)0.5 |
| Mid-Point (arithmetic / production) | AVERAGE(BoP, EoP) |
| BoP Index Chain | BoPn = EoPn-1 |
| Contract Year Index | IF(CY_Start, BoPn, CY_Indexn-1) |
| Phase-Aware Rate | MAX(rate₁ × flag₁, rate₂ × flag₂, rate₃ × flag₃) |
| Escalation Factor from Index | Indext / Indexbasis |
| Stepped/Continuous Toggle | IF(Switch=1, Mid_Index, CY_Index) |
| Real Value from Nominal | Nominalt / Inflation_Factort |
| Average Inflation Factor (exact) | ((1/ln(1+r)) × e(T×ln(1+r)) − (1/ln(1+r))) / T |
Chief Financial Officer & CPA (Inactive). Empowering financial professionals with tools, knowledge, and resources to excel.